Introduction
The OpsRamp Monitoring feature delivers comprehensive, 360-degree visibility into your IT ecosystem, including applications, servers, virtualization platforms, containers, synthetic monitors, storage systems, and network devices. Using monitoring, you can gather information and keep track of the performance of your target resources.
As part of the onboarding process:
- All resources in your network are discovered and managed.
- Monitoring templates are assigned to monitor resources according to the configured metrics.
- Timely alerts are raised for quick action.
The dashboard acts as a window to monitor the health, performance, and availability of resources.
The platform includes hundreds of built-in monitors that capture availability and performance metrics and optimal thresholds for supported resources.
Importance of OpsRamp Monitoring
Monitoring in OpsRamp is essential to understand the real-time health, performance, and availability of IT resources, and how these factors impact service delivery. OpsRamp’s monitoring capabilities support the following:
1. Understand Service Impact
Your organization may manage a range of IT services such as:
- Applications (for example, an order management application)
- Infrastructure services (for example, Wi-Fi for the office)
- IT resources (for example, servers, switches, and routers) deployed in your environment participate (directly or indirectly) in some IT service that serves end users.
Therefore, it is important to have line of sight between IT resources and their impact on users.
2. Cloud-Based Management
OpsRamp is a SaaS-based application. You can log in using your browser to manage your environments from a single location.
3. Platform Extensibility
You can extend the platform to monitor any type of IT resource. Several options are available for configuring or creating custom monitors, including APIs. These APIs enable you to automate integration with your operational workflows.
Access Monitoring Interface
To access OpsRamp monitoring:
- Log in to the OpsRamp portal.
- Navigate to Setup > Account.
- Click the Monitoring card.
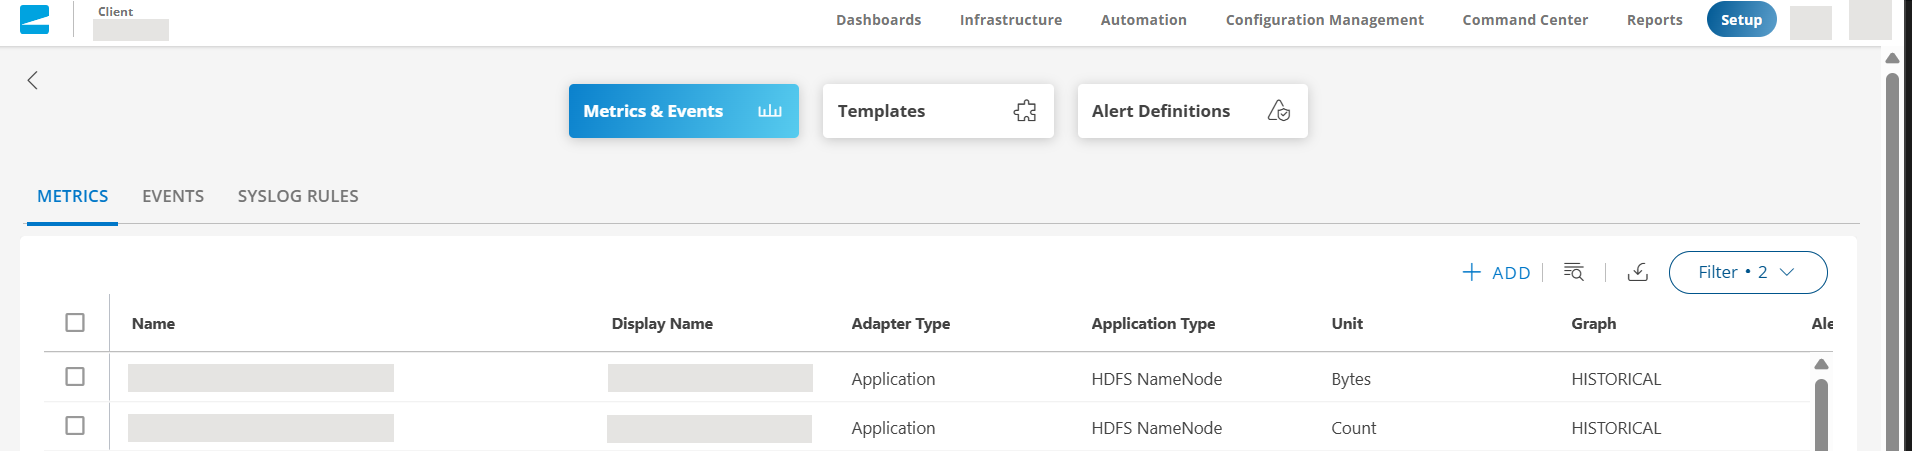
The monitoring interface displays options for managing your monitoring configurations, including the ability to create and configure metrics, events, templates, and alerts.