Introduction
Kubernetes events serve as a valuable source of information, allowing you to monitor the state of your applications and clusters, respond to failures, and perform diagnostics. These events are generated whenever the state of cluster resources—such as pods, deployments, or nodes—changes.
In Kubernetes 2.0, the agent can optionally export kube events as logs and alerts. Users have the ability to filter events based on criteria such as namespace, type (Normal/Warning), object type, and event reasons.
Users can choose to export kube events as logs, alerts, or both. To export events as logs, Log Management must be enabled at the client level.
Prerequisites
While installing the Kubernetes 2.0 Agent, ensure that the Kube Events is enabled.
For more details, refer to the Installation document.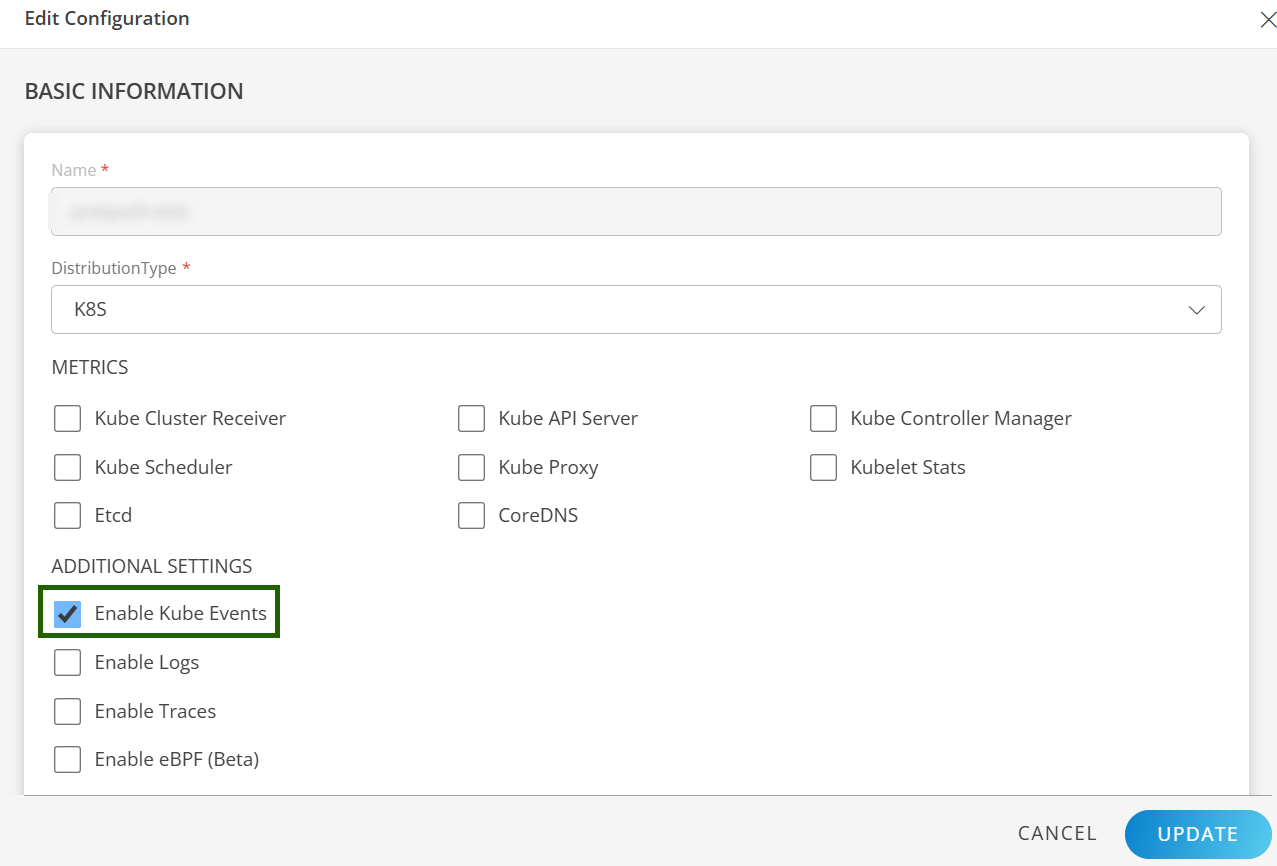
User Configuration
Defaults Configuration
By default, logs are enabled, alerts are disabled, and there are no filters applied to namespaces and event types.
Default ConfigMap Name: opsramp-agent-kube-events
Access the ConfigMap:
To view or edit the ConfigMap, use the following command:
kubectl get configmap opsramp-agent-kube-events -n <agent-installed-namespace> -oyamlOutput:
apiVersion: v1
kind: ConfigMap
metadata:
  name: "{{ .Release.Name}}-kube-events"
  labels:
    app: {{ .Release.Name}}-kube-events
  namespace: {{ include "common.names.namespace" . | quote }}
data:
  eventsConfig.yaml: |
    # There is a universal LOG management setting for all logs.
    # Only if LOG management setting is enabled, logs_enabled setting for kube-events will be effective.
    logs_enabled: true
    alerts_enabled: false
    namespaces:
    event_types:
    include_involved_objects:
      Pod:
        include_reasons:
        - name: Failed
        - name: InspectFailed
        - name: ErrimageNeverPull
        - name: Killing
        - name: OutOfDisk
        - name: HostPortConflict
        - name: Backoff
      Node:
        include_reasons:
        - name: RegisteredNode
        - name: RemovingNode
        - name: DeletingNode
        - name: TerminatingEvictedPod
        - name: NodeReady
        - name: NodeNotReady
        - name: NodeSchedulable
        - name: NodeNotSchedulable
        - name: CIDRNotAvailable
        - name: CIDRAssignmentFailed
        - name: Starting
        - name: KubeletSetupFailed
        - name: FailedMount
        - name: NodeSelectorMismatching
        - name: InsufficientFreeCPU
        - name: InsufficientFreeMemory
        - name: OutOfDisk
        - name: HostNetworkNotSupported
        - name: NilShaper
        - name: Rebooted
        - name: NodeHasSufficientDisk
        - name: NodeOutOfDisk
        - name: InvalidDiskCapacity
        - name: FreeDiskSpaceFailed
      Other:
        include_reasons:
        - name: FailedBinding
        - name: FailedScheduling
        - name: SuccessfulCreate
        - name: FailedCreate
        - name: SuccessfulDelete
        - name: FailedDelete
Namespace Filtering
Users can specify a list of namespaces they are interested in; by default, all namespace events are exported.
Example Configuration:
data:
  eventsConfig.yaml: |
    # There is a universal LOG management setting for all logs.
    # Only if LOG management setting is enabled, logs_enabled setting for kube-events will be effective.
    logs_enabled: true
    alerts_enabled: false
    namespaces: ["default", "agent-namespace", "kube-system"]
Event Type/Level Filtering
Users can provide a list of event types they wish to monitor. Currently, Kubernetes supports two types of events: Normal and Warning.
Example Configuration:
data:
  eventsConfig.yaml: |
    # There is a universal LOG management setting for all logs.
    # Only if LOG management setting is enabled, logs_enabled setting for kube-events will be effective.
    logs_enabled: true
    alerts_enabled: false
    namespaces: ["default", "agent-namespace", "kube-system"]
    event_types: ["Warning"]
Object/Kind Filtering
Users can select specific object types for which they want to receive events and specify reasons for those kinds. Additional attributes can also be added for each reason.
If the “severity” attribute is included, it will generate alerts with the appropriate severity level.
Example Configuration with Severity Attribute:
    include_involved_objects:
      Pod:
        include_reasons:
        - name: Failed
        - name: InspectFailed
        - name: ErrimageNeverPull
        - name: Killing
        - name: OutOfDisk
        - name: HostPortConflict
        - name: Backoff
          attributes:
            - key: severity
              value: Warning
Event Reason Filtering
Users may select an “Other” category and provide any reasons of interest. The reasons specified in include_reasons will be exported regardless of the associated object.
Example Configuration:
      Other:
        include_reasons:
        - name: FailedBinding
        - name: FailedScheduling
        - name: SuccessfulCreate
        - name: FailedCreate
        - name: SuccessfulDelete
        - name: FailedDelete
When users edit the ConfigMap, the OpsRamp portal will reflect these updates in real-time as corresponding events occur within the cluster. This format organizes the information into clear sections, making it easier to read and understand while maintaining all essential details.
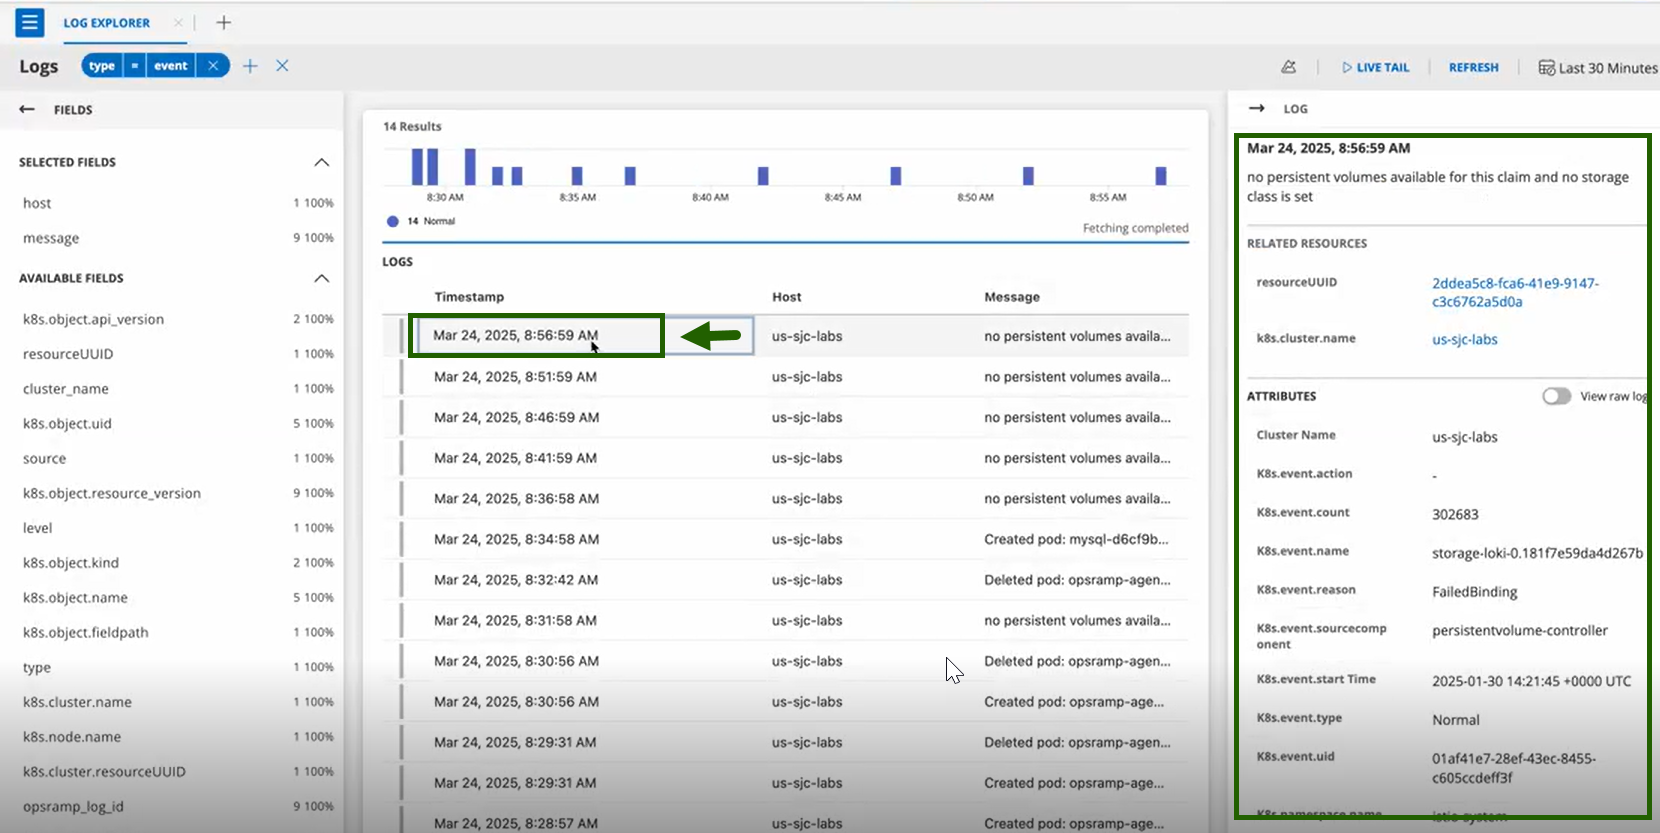
View Events in OpsRamp Portal
- Navigate to Infrastructure > Logs in the OpsRamp portal.
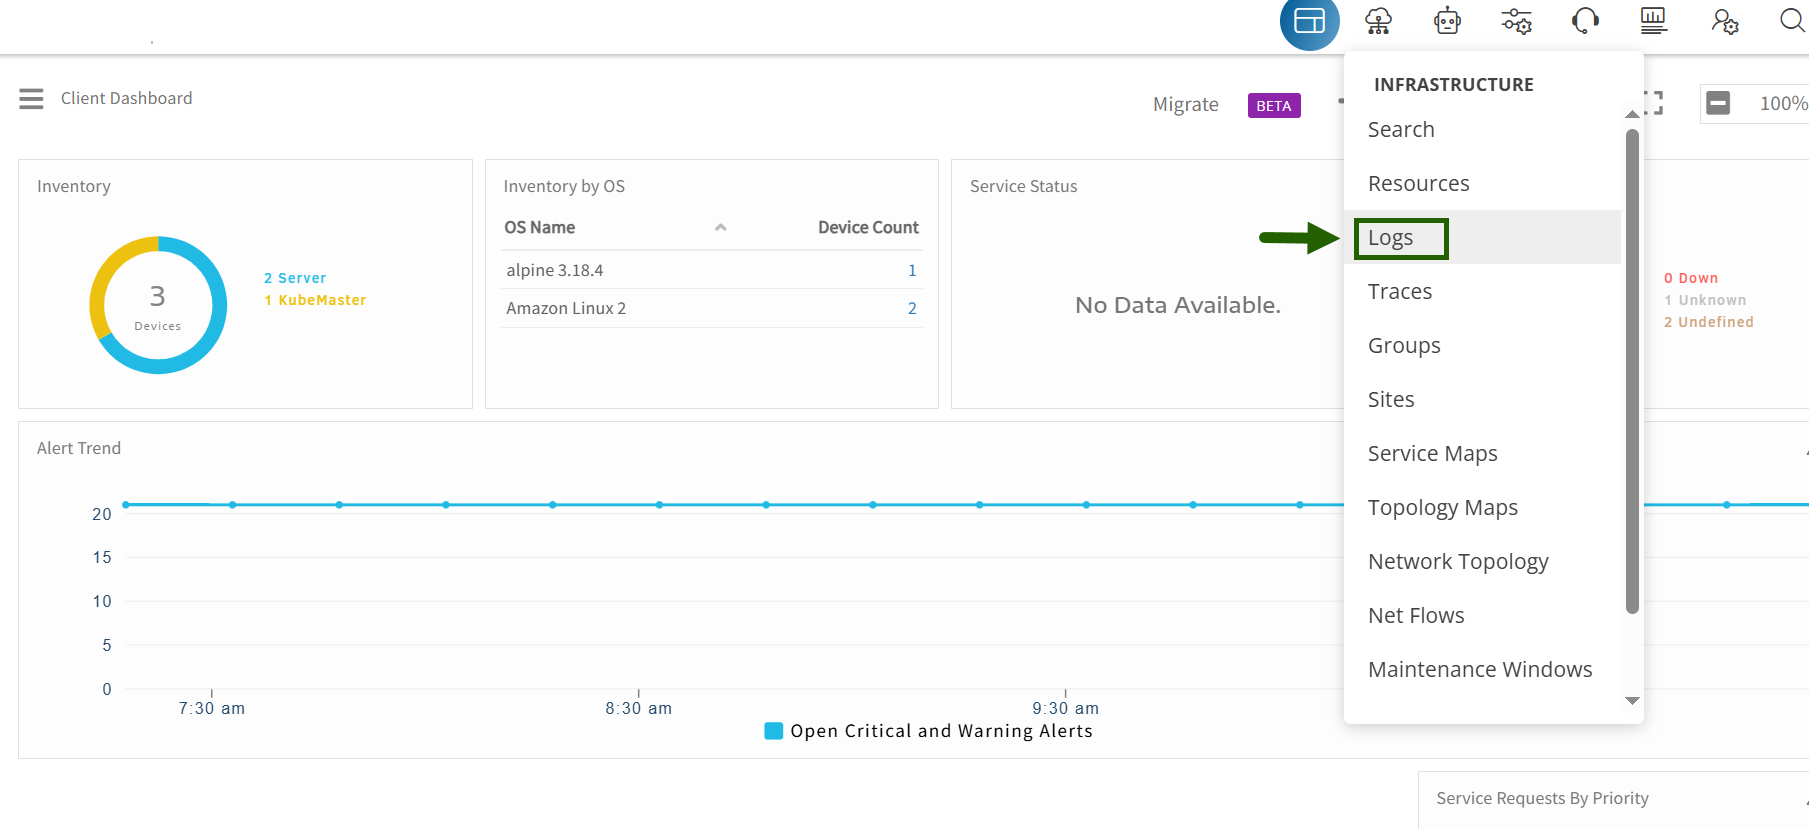
- The Default Logs Screen is appeared.
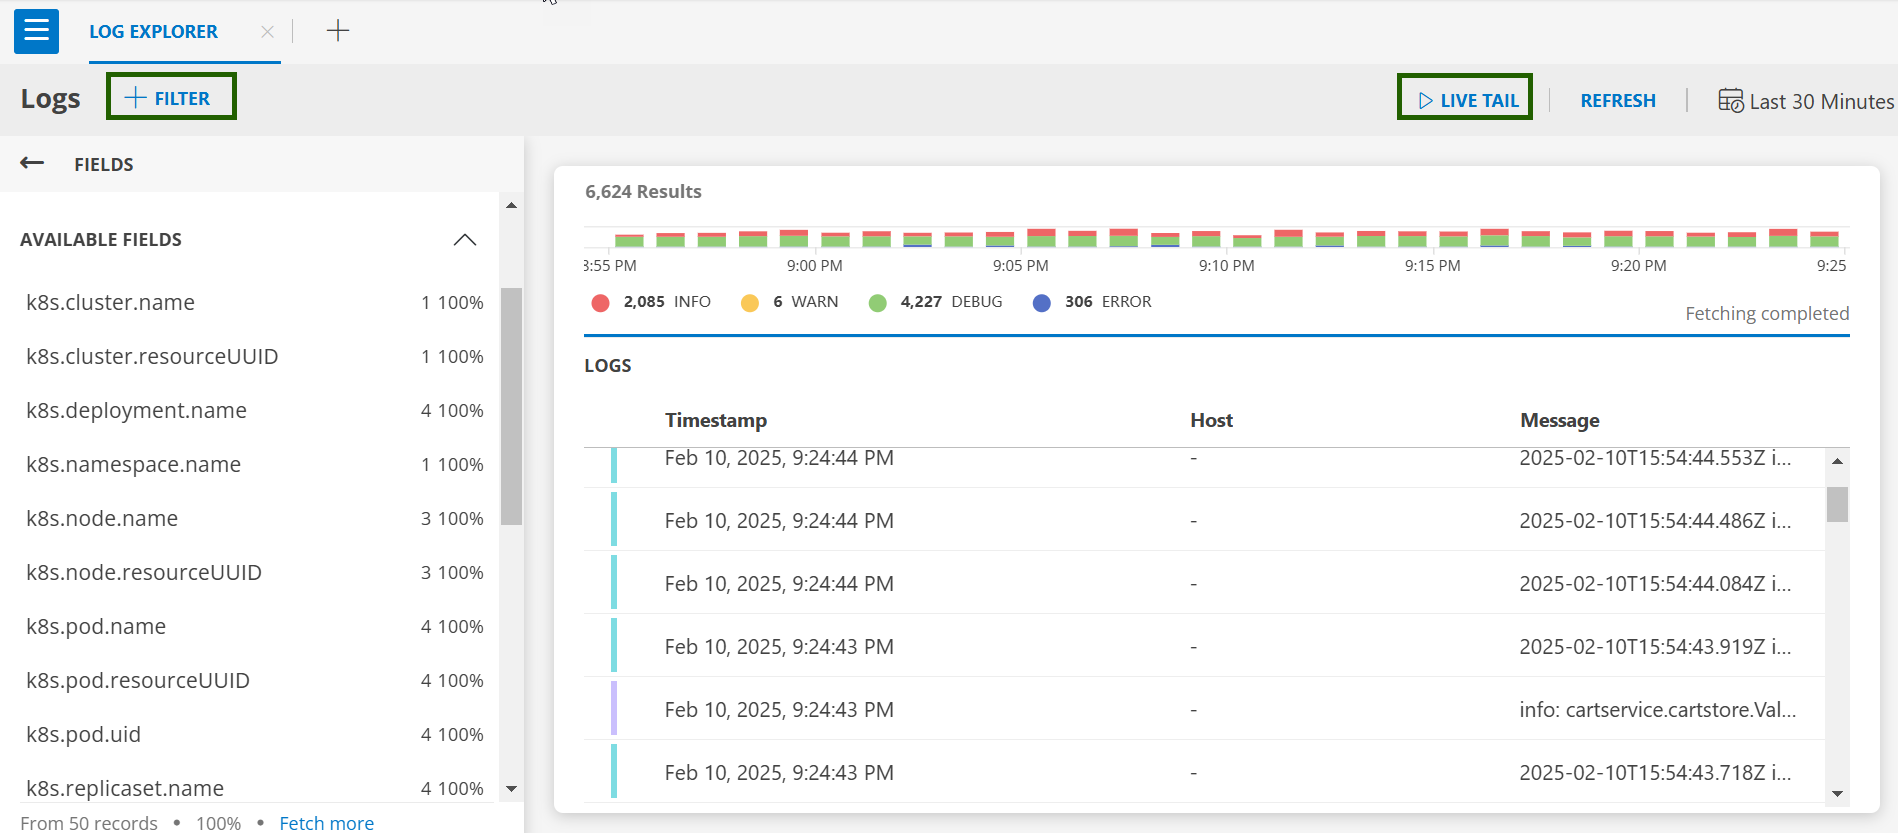
- Click on +FILTER and search for
type = eventsto see the list of events.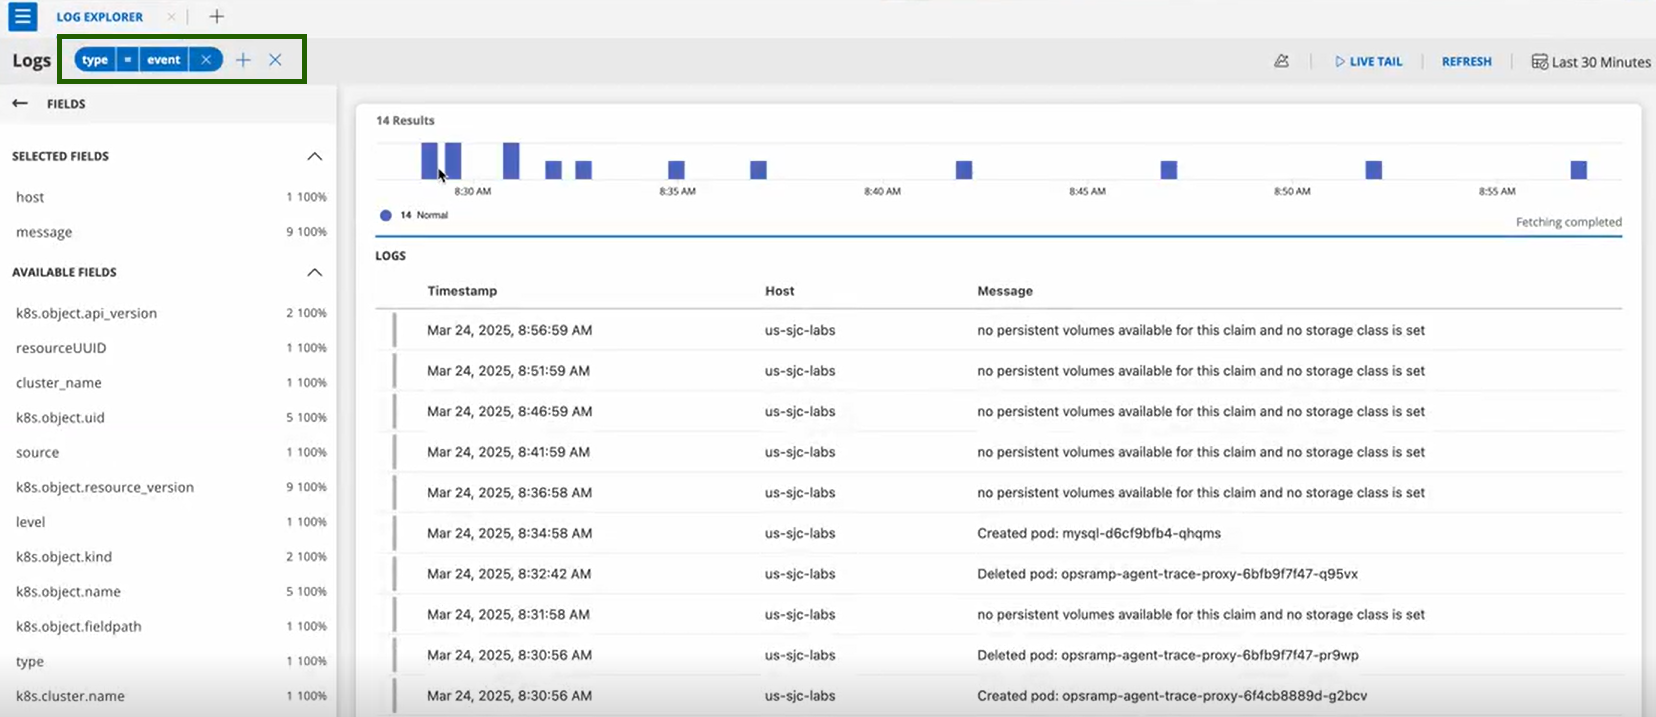
- Click on any event entry for detailed information.
Once you edit the K8s ConfigMap and apply it to your cluster, the OpsRamp Agent will pick up the latest configuration changes within a few minutes. This version organizes the content into clear sections and uses straightforward language for better understanding.
Key Points to Note
- In the log listing UI, the Host column will be empty. Instead, a Resource Name column is displayed, showing the name of the Kubernetes resource associated with the event—for example, the Pod name if the event pertains to a Pod.
- Kubernetes events are now automatically linked to the corresponding resource in OpsRamp. If the resource doesn’t exist, the event links to the cluster.
- Field Differences Between Kubernetes 1.0 and 2.0
- Kubernetes 1.0: The Resource field displays either the IntegrationName or KubeMaster.
- Kubernetes 2.0: The Resource field shows the name of the object that triggered the event as much as possible.
Example: For a Pod Killing event, the Resource will show the Pod name if the Pod’s resourceUUID is available. If not, it will fall back to displaying the cluster name.
- The metric name changed from KubeEvents to kubernetes_events.
- The component format changed to objectUuid - eventReason.
- Some additional attributes have been added based on the event type.
- Alerts do not auto-heal; they must be manually suppressed or resolved.